Gantt Chart Templates are extremely useful for Project Management, Event Tracking or Task Scheduling.
Furthermore, using Gantt Charts in Google Sheet Sheet leaves you with additional advantage of easily collaborating across multiple team members since Google Sheet is 100% and 100% free to use.
In this article we will discuss two ways to using Gantt Charts, via Free Templates or creating a simple Gantt Chart from scratch.
Table of Contents
Free Resources
Before we begin, feel free to grab a copy of the templates discussed in this tutorial in your personal Google Drive.
*Kindly Create a copy instead of requesting access
Creating a basic Gant Chart in Google Sheet
While you can rely on freely available templates(covered in next section), creating a simple one from scratch ain’t very difficult either. Follow the below steps:
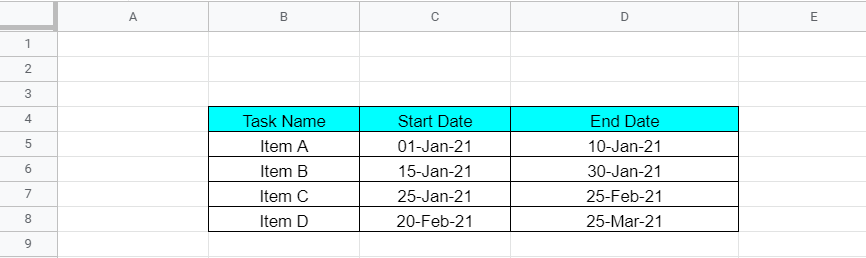
1. Create a data table with Event Name , Start Date and End Date.
2. Create a New Table below. Copy paste Task Name(B5:B8) as it is to the new table(B14:B17).
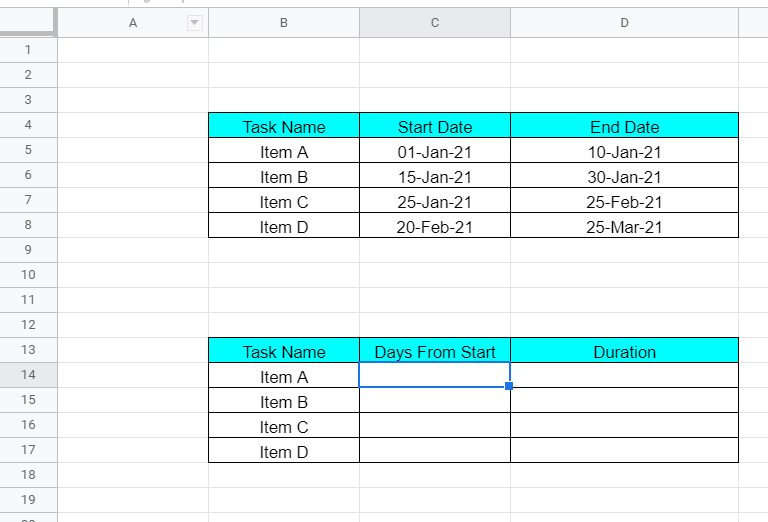
3. In ‘Days from start’ we will calculate the no of days post the first start date(C5) when the Item started. For Example, in C14 apply the below formula and drag&drop upto C17.
=C5-$C$5
4. Similarly, for ‘Duration’ we simply would subtract item ‘End Date’ – ‘Start Date’. Shown below:-

5. Now Select the data, B13:D17 and goto Menu Options -> Insert -> Chart. Google sheet is smart enough to directly select a Stacked Bar Chart Option for us.
5. In this step, we intend to
- Uncolor the Blue-Bar
- Add Data Labels to the Red-Bar

- Remove the Legend
- Edit the Chart Title
At the end of all this, we have a simple Gantt Chart ready. You can tweak the start and end dates in Table 1 to update the chart as required.

Using Freely Available Gantt Chart Template in Google Sheet
Google Sheets Template Gallery though small, but is power-packed with so many useful pre-built templates. Gantt Chart Template is one of them, provided by Smartsheet.
Importing Gantt Chart Template from Template Gallery
1. Open Google Sheets. A page like below should open.

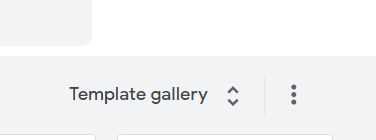
2. Click on “Template Gallery” present in top right corner.
3. A whole list of free templates opens should open-up. Something like below:-

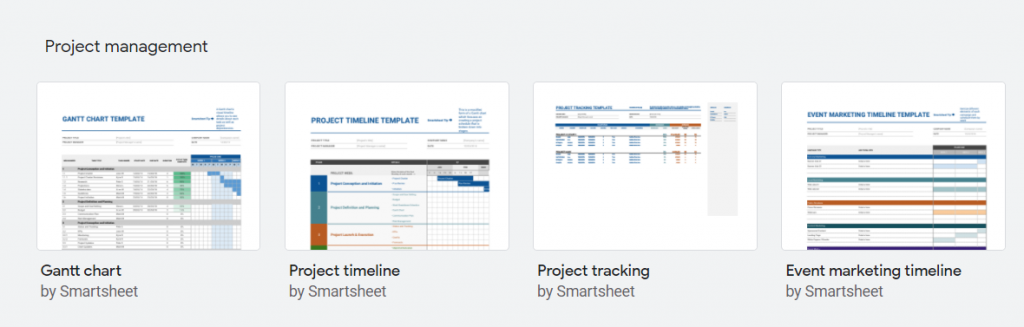
4. Now, Scroll down and you’ll find a host of templates freely available for use. Find the header “Project Management” and download the Gant Chart Template by Smartsheet.
5. Below sheet should open up.

Using the Gantt Chart Template
The Gantt Chart template is a comprehensive one, and fully on us to edit as per our need. Below are some of the changes you can make to begin with:-
1. Add basic project details.

2. Edit the Task Title, Task Owner, Due Date, Start Date etc. As you would notice fields like duration gets auto calculated.

3. Update the %task complete and color code the days.
In a similar way update the rest of the rows too to complete the overall Gantt Chart.
That’s it on this topic. If you still have any questions, then drop a comment below. Keep browsing SheetsInfo for more such useful information 🙂